The two proportion z test calculator with a step-by-step solution compares the proportions of two groups. We updated the calculator on 4-Dec-22 and changed the default continuity correction to don't use (false). (old calculator)
![]()
Checks if the difference between the probability of succees (p) of two groups is significant, based on a sample data
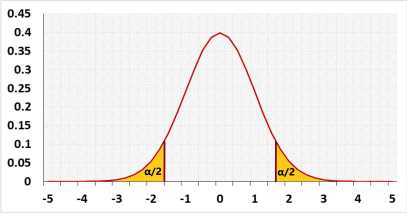
Normal distribution
The continuity correction is applied when a continuous distribution is used to approximate a discrete distribution. In the two proportion z test, you use the continuous normal distribution to approximate the discrete binomial distribution.
By using the continuity correction, the results will be more similar to those obtained from the binomial distribution. However, in most cases the results with the normal approximation support a better results than the results with the binomial distribution, or the results with the continuity correction.
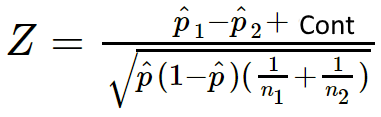
The continuity correction C adjust the statistic toward the zero.
p̂₁ < p̂₂: F = 1.
p̂₁ > p̂₂: F = -1.
p̂₁ = p̂₂: F = 0.
The continuity correction cannot change the direction of the statistic i.e. correct positive statistic to negative, or vice versa.
C = Min(C, Abs(p1 - p2)).
Please note, the standard deviation in binomial distribution depends on the proportion. Since the null assumption of this test is that the proportions are equal, p1 = p2, when calculating the standard deviations we calculate it based on the pooled proportion:
Since the confidence interval doesn't assume that the proportions are equal, you can't reject the null assumption based on the confidence interval range.
When calculating the confidence interval of the difference between two proportions, we assume unequal proportions, p1 ≠ p2. Hence we calculate the standard deviation of each group based only on the individual group's data. In this caste we use p̂₁ and p̂₂ instead of p̂*₁ and p̂*₂.
The following R code should produce the same results:
The prop.test using the Chi-squared statistic with one degree of freedom, which is the same as using the Z test: z 2 =χ 2 (1)